Sometimes updating alias tables in EAS using the Export/Import Alias Table menu items can be tedious. Especially if there are a lot of members and the alias can be easily built (ex: with a concatenate function in Excel). If the table already exists you can set the changes up in Excel and use a load rule to update.
You can select what alias table your load rule is updating in the Dimension Build Settings window on the Global Settings tab. In the Update alias table section, select the alias table from the drop down list. If you want to update more than one alias table for each member, you will need a load rule for each alias table. Set your file up to contain each alias table in a column. Complete the load rule for one of the alias tables and then change the alias table to update and the field properties of the appropriate column, saving a load rule for each. Using Load Data, you can select your data file multiple times, applying the multiple rules for each alias tables.
I have found two uses that this is exceedingly more useful than the Export/Import functionality, where you have to update a text file editor. One is to populate a week ending date in my weekly cubes. I can select my first date and then add 7 to advance the date. Another use is to append the member name to the end of the alias. The result of this is twofold, one it prevents duplicate aliases and two it allows both the member name and alias to be visible when using Smart View.
There are still going to be times where Exporting and Importing an alias table is going to be more useful, but load rules are another viable option, which may save you time in the long run.
Monday, June 7, 2010


Friday, May 21, 2010
Ranking Reports
Hyperion Financial Reporting Studio lets you create ranking reports easily by using the built in functionality, but it is available only when there is one dimension on the row. It is also only available for ranking the Top n number of dimensions and not available for the Bottom n number of dimensions. What happens when you want to have more than one dimension on the row or want to rank the Bottom members of a dimension gets more complicated.
 To show the Top 5 products from this list, select row 1 and apply suppression to an row where Column F is > a value of 5. Also, select suppression for where Column F is equal to Zero or No Data. Additionally, using the Grid Properties pane, apply a sort to Row 1 using Column F in ascending order. The column containing the rank can be hidden on the final report.
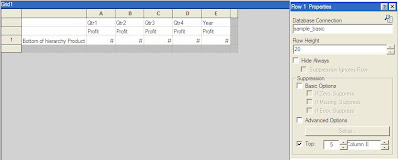
Using the built in functionality we can create a report of our top 5 products. The product can be put on the row with quarterly and total year Profit on the columns. By highlighting the row, the ability to select the Top n results based upon a column selection becomes available in the Properties pane on the right. The resulting report, shows the top 5 products by year and sorts them in descending order.
There is also a Rank() formula that can be used. This works around both of the drawbacks of the built in Ranking functionality. It allows you to sort ascending or descending. It also allows you to rank members when there is more than one dimension on the row. It will rank based upon the rightmost dimension on the row.
The syntax for the formula is Rank([Reference], Order, Unique(optional)). The Reference can be a cell, row, or column. Order for ascending can be specified as Ascending, Asc, or 1. The order for descending can be specified as Descending, Des, Desc, or 0. Unique is used to indicate how to treat equal values where false gives equal values the same ranking and true gives each value a unique ranking and there is no duplication.
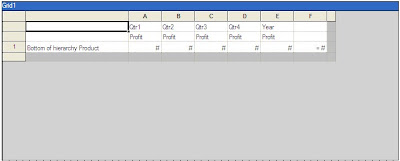
The following achieves the same ranking as above when using the formula Rank([E, 1], Descending ,true). This formula ranks each line but does not filter the results. The ranking for each product can be found in Column F.
To show the Top 5 products from this list, select row 1 and apply suppression to an row where Column F is > a value of 5. Also, select suppression for where Column F is equal to Zero or No Data. Additionally, using the Grid Properties pane, apply a sort to Row 1 using Column F in ascending order. The column containing the rank can be hidden on the final report.Alternatively, a Bottom 5 products report could be created by changing the formula to be Rank([E, 1], Ascending ,true).
Applying all of the same row and report properties as above, here is an example of a report that lists the top 5 markets for each product line.
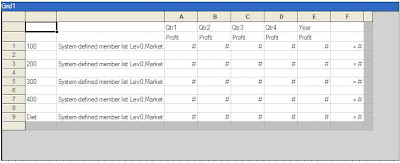
If there is a need to create a report with both the Top 5 and Bottom 5 members in one report, an additional row can be created for each of the rows. One row will have the rank formula ascending and one will have the formula descending. Additional sorting can be added to the descending rows to have the entire column sorted in order.
An excerpt of the resulting report would be as follows.
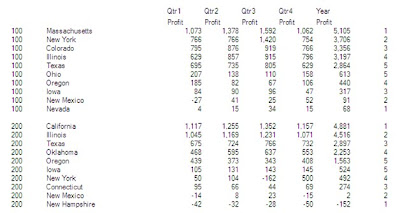 The next hurdle is what happens if there are less than 10 markets with data. This will cause duplication in rows on the report, which is not the desired result.
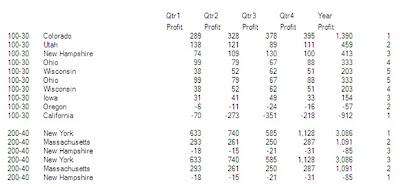 In this example, Ohio and Wisconsin are duplicated for 100-30 since there are only 8 Markets for this product line with data. All 3 markets are duplicated for 200-40, because there are only 3 markets populated.
To work around this duplication issue a Max formula can be used on one of the ranking rows and then suppression can be built on the second that utilizes this Max formula.
In the example, insert a formula row for Row 3. In Column F, specify the formula as Max([2]). Change the Row 2 suppression to exclude the entire row if the Max is less than or equal to 5 and specify to exclude the larger rankings for each of the instances where there between 6 and 9 members in the grouping. The suppression for Row 2 in the sample report would be:
- Data Values in Column F > Value of 5 Or
- Data Values in Column F = Zero Or
- Data Values in Column F = No Data Or
- Value in Cell F,3 <= Value of 5 Or
- ( Value in Cell F, 3 = Value of 6 And
- Data Values in Column F = 5 ) Or
- ( Value in Cell F, 3 = Value of 7 And
- Data Values in Column F = 4 Or
- Data Values in Column F = 5 ) Or
- ( Value in Cell F, 3 = Value of 8 And
- Data Values in Column F = 3 Or
- Data Values in Column F = 4 Or
- Data Values in Column F = 5 ) Or
- ( Value in Cell F, 3 = Value of 9 And
- Data Values in Column F = 2 Or
- Data Values in Column F = 3 Or
- Data Values in Column F = 4 Or
- Data Values in Column F = 5 )
The resulting report will then look exclude the duplications.
Friday, April 23, 2010
Date Dimension Display Problem
Last week I was working with one of the new features introduced to Essbase in version 11, date dimensions.
The goal is to store a start date and end date that can be utilized in calculations. I first started looking for where to enable dates and ended up stumbling upon a less intuitive step. To utilize dates you must Enable Typed Measures in the Outline Properties tab. I agree to the somewhat scary message that once enabled in an outline this cannot be disabled. After that a date format must be selected. I chose mm/dd/yyyy since it aligns with my source data. Now I was ready to add my two new dimensions, Start Date and End Date. I set them up to be a Date Type and to never aggregate and save my outline changes. I did a quick test of submitting data to the cube using Smart View. When I retrieved the results back everything looks perfect. I have dates in the cube and everything is looking good.
I then moved toward setting up my load rule to load my dates and my data. For right now I am using a flat text file. I set everything up and load data. After getting a success message, I went to validate my data in Smart View and that is where things started to get interesting. Every date is off by one day. My 02/01/2010 start date is showing 01/31/2010. I figure I must have set something up wrong and go back and verify my outline and load rule settings. I find everything in its place. I spent some time researching online and on the message boards and don’t find anyone having a similar issue. I went through the Knowledge section on My Oracle Support searching for an Essbase bug that might explain my bizarre results, no dice.
Not really sure what to do next, a level 0 export is pulled look at the underlying data. Low and behold, there is the 02/01/2010 start date. So the data is being loaded correctly, but not being reflected correctly in Smart View. A quickly built report in Financial Reporting Studio finds the data being displayed incorrectly there as well. Armed with this information, article 950835.1 is found on the Knowledge section of My Oracle Support. It’s a bug! And it is due to be fixed in version 11.1.2.
So now there are two immediate courses of action that come to mind, neither of which are ideal.
1) Load the data and have it display as one day off until the system is upgraded to 11.1.2. The up side to this option is that no data will need to be reloaded once the upgrade has taken place. The down side is that this may not be a viable option for the business.
2) Adjust the upload file to increase the date by one day so that when it is loaded, it will display the correct data. The upside to this is that the business is happy and dates are accurately reflected for reporting. The down side is that once an upgrade takes place, the data will have to be reloaded or else all are dates will be wrong. Remember the dates are correct in the database and are only displaying incorrectly.
So I take the weekend away for this and figure I may have to explain to the business the situation and find out how important the date is or if one day will make a difference or not. Then it hits me there is another solution. The dates can be loaded as they are to a member that is called Start_Date. Another member can be set up with a member formula that advances the date by one day. Access to Start_Date can be restricted or moved to an area in the Measures dimension that will be ignored by the end user. This is a win-win situation. The data is loaded correctly in the database now and can be accurately reflected for reporting. Once upgraded to the version with the fix, the calculated member can be removed and the stored member renamed and no data will need to be reloaded.
The only part that hasn’t been tested in this theory yet is the ease of doing calculations off of the calculated member. If that gets to be cumbersome though, adjustments can be made to calculations to simply add 1 to whatever the result is.
Subscribe to:
Posts (Atom)